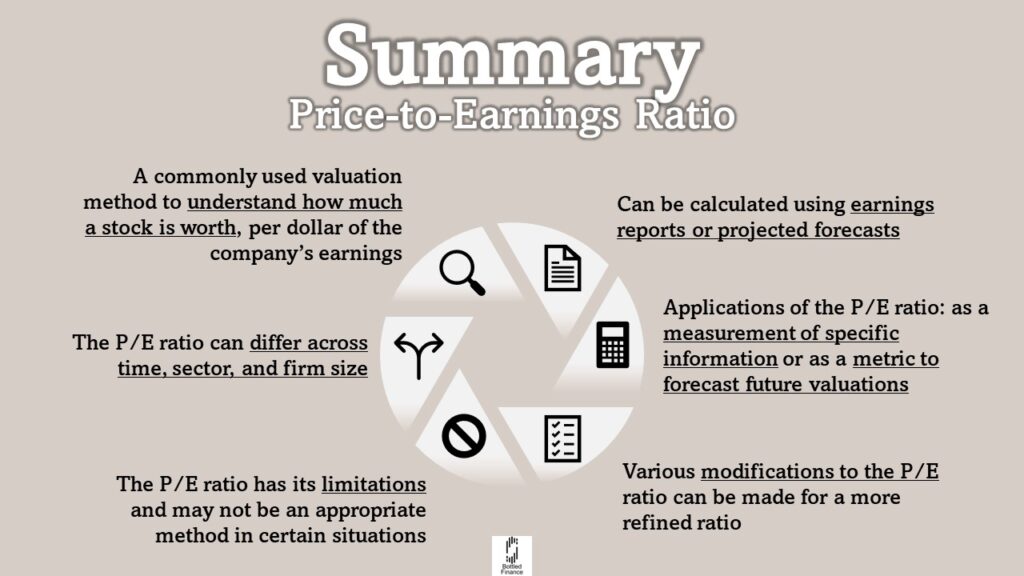
In the field of finance, various valuation metrics assist investors and analysts in evaluating companies, yet one stands out for its simplicity and popularity: the Price-to-Earnings (P/E) ratio (Espinasse, 2014).
The P/E ratio provides a straightforward method for assessing how the market values a company relative to its earnings per share (Espinasse, 2014), making it a cornerstone in investment decision-making.
Formula & Calculation
Trailing P/E Ratio
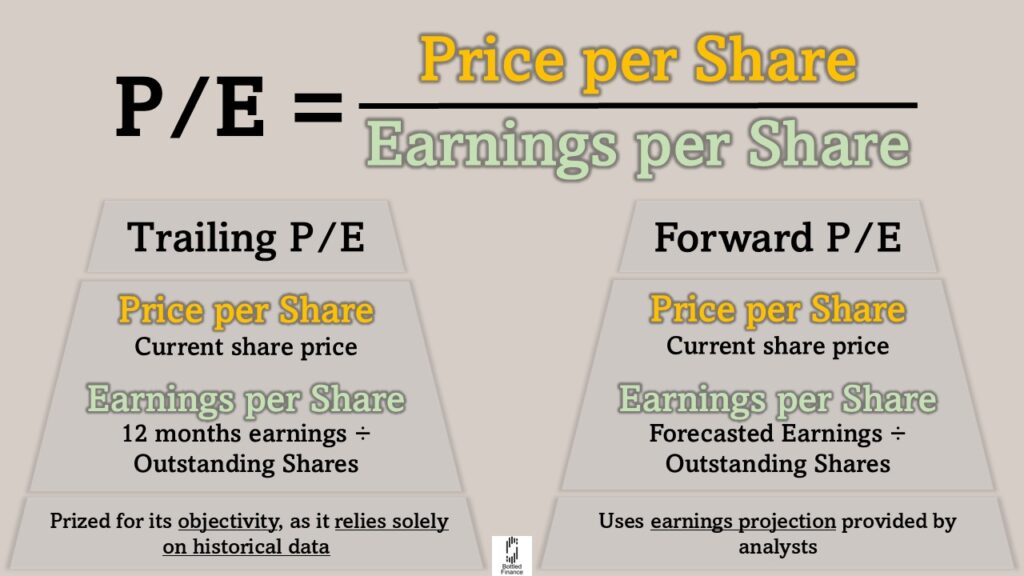
The Trailing P/E ratio is calculated by dividing the current share price by the company’s earnings per share (EPS) over the past twelve months, according to Bulkowski (2012) and Calhoun (2020).
Trailing P/E = Price per share ÷ Earnings per Share(Trailing Twelve Months)
(Bulkowski, 2012; Calhoun, 2020; Espinasse, 2014)
The components of the trailing P/E ratio include the company’s share price and its trailing twelve months earnings per share (EPSTTM), which is determined by the net earnings reported by the company in the previous 12 months divided by its total outstanding shares (Calhoun, 2020).
This formula provides a clear assessment of a company’s valuation based on its most recent earnings performance (Bulkowski, 2012; Calhoun, 2020; Espinasse, 2014).
The Trailing P/E ratio is prized for its objectivity, as it relies solely on historical data without the influence of any forecasts or assumptions (Calhoun, 2020).
However, this retrospective focus is also considered a limitation (Calhoun, 2020).
Forward P/E Ratio
If available, the P/E ratio could also be calculated using projected future earnings (Bulkowski, 2012; Espinasse, 2014; Calhoun, 2020).
Like the Trailing P/E ratio, the Forward P/E uses the company’s share price as the numerator.
However, the denominator in this ratio consists of earnings projections of the upcoming year’s earnings per share; these earnings forecasts are derived from estimates provided by a specific group of analysts (Calhoun, 2020).
The Forward P/E ratio typically relies on a one-year earnings projection to combat the uncertainty associated with longer-term forecasts (Calhoun, 2020).
Since analysts primarily derived the earnings projection from the operations of the company rather than attempting to predict isolated events, the Forward P/E ratio often exhibits greater stability and less volatility compared to actual reported earnings (Calhoun, 2020).
Trailing or Forward?
Depending on their risk tolerance, some investors may prefer a more conservative approach by relying on the Trailing P/E ratio, while others with a more optimistic view may incorporate the Forward P/E ratio into their analyses (Calhoun, 2020).
It is important to note that companies expected to grow typically have a lower Forward P/E ratio than its Trailing P/E ratio; this discrepancy occurs because as expected earnings rise, dividing by a larger earnings figure lowers the ratio itself (Calhoun, 2020).
While the Trailing P/E ratio is grounded by objective historical data provided directly by the company, this approach is also considered a limitation (Calhoun, 2020), as it limits its effectiveness in accounting for future company prospects and market expectations.
Furthermore, despite the Forward P/E ratio often being more predictive, it is important to recognize that forecasting future earnings involves inherent biases and optimistic projections (Calhoun, 2020).
Characteristics of the P/E Ratio
P/E Ratio Across Time
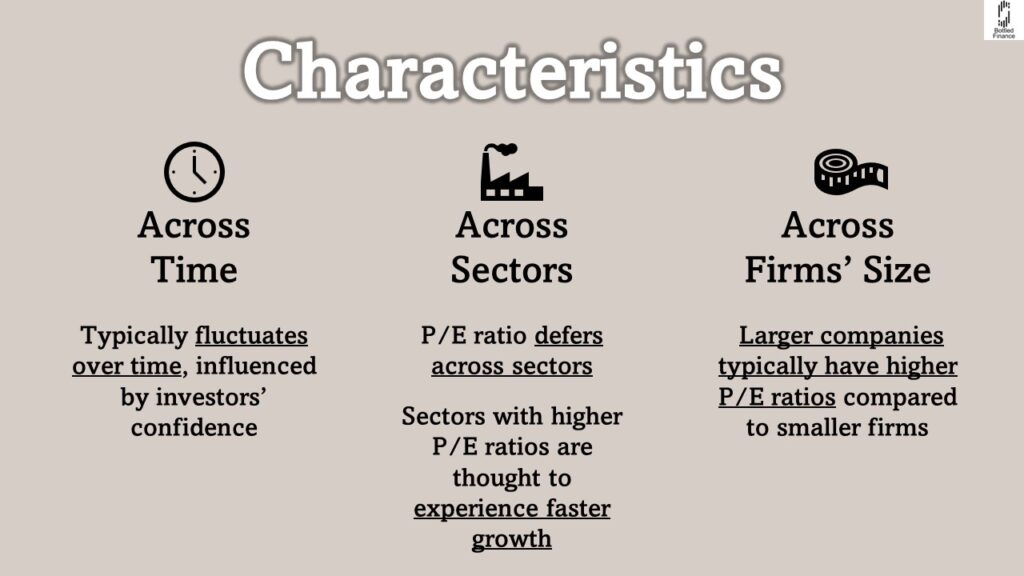
The P/E ratio typically fluctuates over time, influenced by investors’ confidence (Anderson & Brooks, 2005).
P/E Ratio Across Sectors
According to Anderson and Brooks (2005), various sectors display differing P/E ratios.
Sectors with lower P/E ratios tend to yield lower returns, suggesting that sectors with higher P/E ratios, such as software companies, are perceived to experience faster growth compared to sectors like water supply or utilities, which have lower P/E ratios (Anderson & Brooks, 2005).
P/E Ratio Across Firms’ Size
Additionally, larger companies typically have higher P/E ratios compared to smaller firms (Anderson & Brooks, 2005).
Anderson and Brooks (2005) also observed a strong positive correlation (r = 0.82) between market size and P/E ratio, suggesting that as firm size increases, there is a corresponding increase in price premium.
This price premium observed for larger firms may be attributed to the liquidity challenges faced by fund managers, as only these companies can offer the required share liquidity without causing significant adverse effects on market prices (Anderson & Brooks, 2005).
However, Anderson and Brooks (2005) note that as companies grow larger, their P/E ratios tend to increase while their returns diminish.
Applications of the P/E Ratio

The uses of the P/E ratio can be classified into two primary purposes: as a metric to reveal specific information and as a tool to forecast future valuation (Calhoun, 2020).
Forecasting Stock Prices
The P/E ratio is widely used to forecast future returns, research suggests that stocks with lower P/E ratios typically yield higher returns (Calhoun, 2020; Fuller et al., 1993; Anderson & Brooks, 2005; Basu, 1977).
Despite its limitations as a short-term price predictor, Calhoun (2020) argues that the P/E ratio effectively forecasts long-term stock prices; over a 10-year period, the Forward P/E ratio can account for up to 80% of market trends.
However, the fluctuations in share prices are not solely driven by company fundamentals but can also be influenced by external factors. The tendency for low P/E stocks to yield higher returns may stem from behavioral biases among investors-undervaluing low P/E stocks while overvaluing high P/E stocks (Fuller et al., 1993).
Screening for “Value” Stocks
As studies suggest that stocks with low P/E ratios yield higher returns, many value and contrarian fund managers identify “value” stocks by using P/E ratios as indicators – a strategy known as value investing (Calhoun, 2020; Anderson & Brooks, 2005).
According to Calhoun (2020), the Forward P/E ratio generally proves more effective than the Trailing P/E ratio when identifying undervalued or cheap stocks.
Basu (1977) discovered that from April 1957 to March 1971, portfolios with low P/E ratios consistently achieved higher risk-adjusted returns compared to those with high P/E ratios.
However, it should be noted that the reliability of the value signal during bull markets comes into question, as evidenced by its disappearance during the market surge of 2018, where high-P/E stocks significantly outperformed low-P/E stocks (Calhoun, 2020).
Index Construction
Market ratios can also be used to create themed indexes. For instance, an index focused on “Growth” stocks might include companies with high P/E ratios, whereas a “Value” index could be composed of stocks with low P/E ratios (Calhoun, 2020).
Peer Evaluation
Investors and analysts could also adopt the P/E ratio to evaluate the company’s stock prices compared with those of other companies in the same industry (Calhoun, 2020).
Evaluating Corporate Transactions
Ratios can also guide investors and analysts in determining the appropriate valuation of complex business transactions (Calhoun, 2020).
In transactions such as mergers and acquisitions, dispute resolutions, or the restructuring of business portfolios — where public market prices may not provide a clear benchmark — stakeholders often rely on multiples for insights on strategic decisions and fair valuation (Calhoun, 2020).
Evaluating Conglomerate/Sum of the Parts Analysis
Ratios allow for the independent evaluation and analysis of each business segment by calculating their earnings separately as though they were standalone businesses. This method simplifies comparison of the business segments with similar companies (Calhoun, 2020).
Furthermore, using ratios can uncover inefficiencies in operating an overly diversified business portfolio, revealing the potential benefits of restructuring to enable business units to concentrate on their respective niches and potentially enhance overall value (Calhoun, 2020).
Evaluating Market Trends
The P/E ratio could also help identify market trends and evaluate future developments; an unusually high market ratio might indicate the possibility of an upcoming bear market (Calhoun, 2020).
Providing Investment Guidance
In practice, the P/E ratio is one of the most significant metrics; it is used with other valuation multiples to assess investment prospects and create strategies to achieve better returns (Calhoun, 2020).
High P/E or Low P/E?
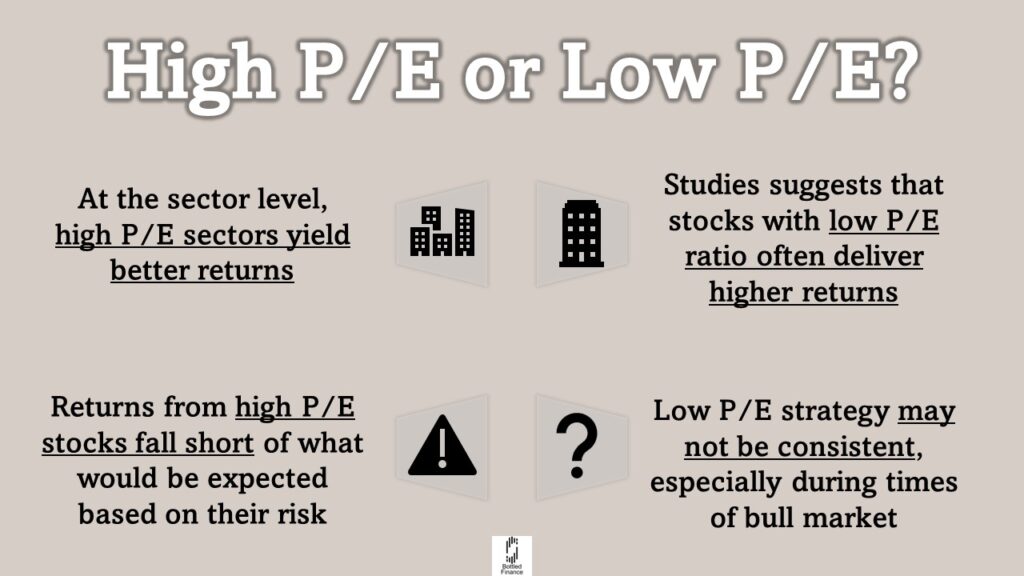
Numerous studies have indicated that stocks with lower P/E ratios often deliver better returns than those with higher P/E ratios (Bulkowski, 2012; Anderson & Brooks, 2005; Fuller et al., 1993; Basu, 1977).
For instance, Bulkowski (2012) discovered that investing $10,000 in stocks with a below-median P/E ratio yielded a gain of $7,843 over a five-year period, compared to a $5,803 gain from stocks with an above-median P/E ratio during the same period.
The research also revealed that stocks with low P/E ratios resulting from declining prices and rising earnings generally offer the highest returns, with stocks experiencing simultaneous increases in price and earnings also showing strong returns (Bulkowski, 2012).
The assumption that lower P/E stocks carry higher risk was tested, and studies found that low P/E portfolios, when evaluated on a risk-adjusted basis, offer returns that surpass what would be expected given their level of risk (Anderson & Brooks, 2005; Basu, 1977).
In contrast, high P/E stocks were found to generate returns that fall short of what would be expected based on their risk (Basu, 1977).
However, Anderson and Brooks (2005) suggest that, at the sector level, a lower P/E ratio typically reflects poorer returns. For instance, they noted that the software sector, characterized by higher average P/E ratios, yields better returns over time compared to the water supply sector, which typically has a substantially lower average P/E ratio. They attribute this difference to the greater long-term growth potential of the software sector compared to the water supply sector.
Additionally, Calhoun (2020) pointed out that the “value signal” from low P/E ratios may “disappear for periods of time, especially in bull markets,” which raises concerns about the effectiveness of low P/E strategies during times of market rally.
Moreover, Bulkowski (2012) notes that not all low P/E stocks are equally valuable; if a stock’s P/E ratio has been high over several years but has recently dropped to an unusually low level, it might then represent a good investment opportunity.
Limitations
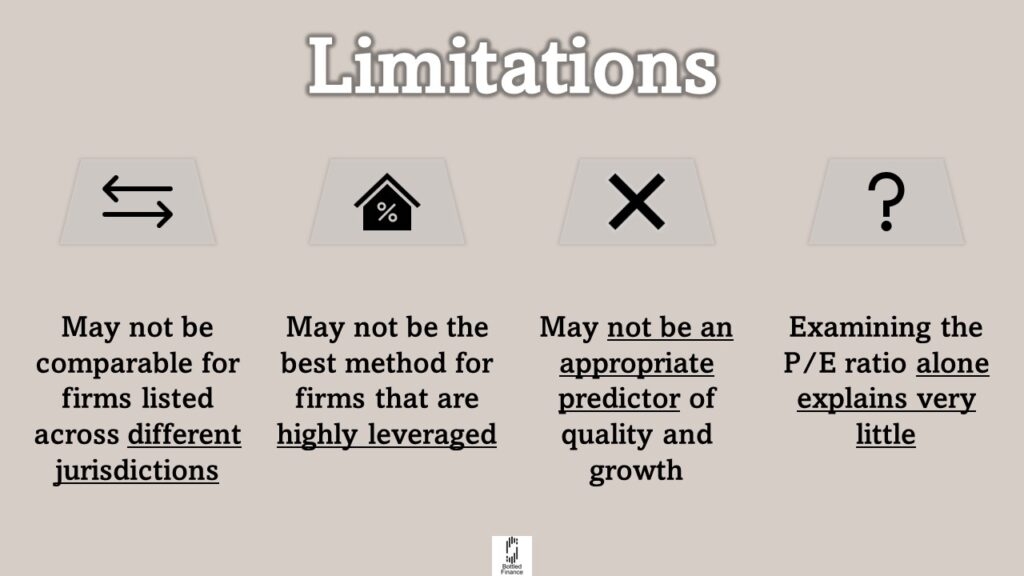
May Not Be Comparable for Firms Listed Across Different Jurisdictions
Using the P/E ratios to compare companies across different tax jurisdictions and accounting policies can lead to inaccurate conclusions due to incompatibilities in comparisons (Espinasse, 2014).
May Not Be the Best Method for Firms that are Highly Leveraged
Similarly, the P/E ratio might not be the most fitting valuation method for companies with substantial recurring cash flow but are highly leveraged; in this case, the EBITDA multiple is considered a more appropriate alternative (Espinasse, 2014).
May Not Be an Appropriate Predictor of Quality and Growth
The belief that the multiple is a factor driven by earnings or sales growth of the business and therefore, companies with a high P/E ratio would generate higher future earnings, may be flawed. In many reported studies, a high P/E ratio often signals poor future stock market performance (Calhoun, 2020).
Examining the P/E Ratio Alone Explains Very Little
Examining the P/E ratio in isolation may not provide a complete view of the stock’s value. According to Bulkowski (2012), adopting a “value strategy” for stocks with consistently low historical P/E ratios may not be an effective strategy.
Instead, by evaluating additional factors concurrently—such as historical P/E ratios, price changes, earnings changes, and other fundamental business considerations—investors can gain a more comprehensive insight into the P/E ratio (Bulkowski, 2012).
Modifications to the P/E Ratio
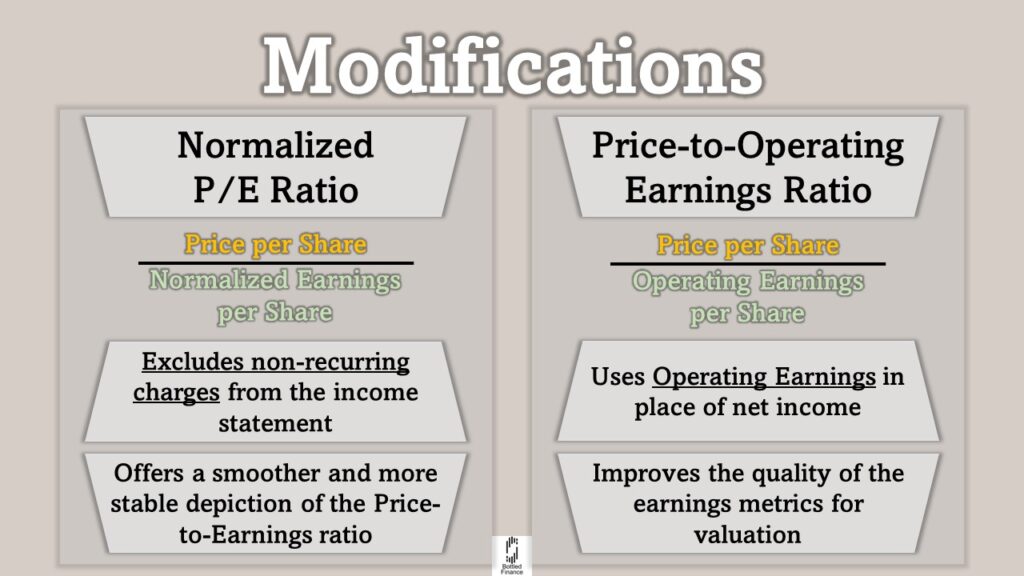
Normalized P/E Ratio
The Normalized P/E ratio excludes non-recurring charges that influence the income statement only once or only during specific periods (Calhoun, 2020).
By filtering out one-time gains and seasonal variations, it offers a smoother and more stable depiction of the Price-to-Earnings ratio (Calhoun, 2020).
Price-to-Operating Earnings Ratio
Some analysts advocate the use of Operating Earnings in place of net income (Calhoun, 2020).
Similar to the Normalized P/E ratio, Price-to-Operating Earnings improve the comparison of company performance across different periods by only including earnings from operations, thus improving the quality of the earnings metrics for valuation (Calhoun, 2020).
Concluding Remarks
While the P/E ratio is a convenient and effective tool for investment guidance, it should not be the only factor in the decision-making process.
Sound investment strategies should also consider the company’s performance, historical valuations, industry trends, economic conditions, and more.
Combining the P/E ratio with other valuation methods will offer a more comprehensive view of a company’s quality, as the P/E ratio alone merely indicates the price relative to a dollar of earnings.
